On Tuesday, October 6, 2026, the Lotto Max jackpot sits at $70 million — the maximum cap the game allows. Alongside it, 10 additional MAXMILLIONS prizes of $1 million each and 70 MAXPLUS prizes of $100,000 are up for grabs. The last draw on Friday, October 2, produced the numbers 02-04-20-23-25-41-47 with a bonus of 26, and no one matched all seven. In late August, a single ticket in Quebec claimed a $55 million prize, instantly creating one of Canada’s newest multi-millionaires.
Millions of Canadians are checking results right now. But how many of them actually understand what they’re buying when they hand over $6 at the counter?
This article isn’t about lucky numbers or dream interpretations. It’s about cold, verifiable mathematics — the combinatorics, the probability theory, and the expected value calculations that define exactly what a Lotto Max ticket is worth. Whether you play every week or have never bought a ticket, understanding these numbers will fundamentally change how you see the lottery.
The short answer is uncomfortable: your odds of winning the jackpot are 1 in 33,446,140. But that number alone doesn’t tell the full story. The math behind it — and behind every prize tier, every MaxMillions draw, and every dollar you spend — is far more interesting than the number itself.
How Lotto Max Works: The Rules Behind the Numbers
The Basic Structure
Lotto Max is deceptively simple on the surface. You select 7 numbers from a pool of 1 to 50 on each selection. A standard play costs $6 and gives you 4 selections — four independent chances to match the drawn numbers. Draws happen every Tuesday and Friday.
The draw itself pulls 7 main numbers plus 1 bonus number from the same pool. The bonus number is relevant for several prize tiers but not for the jackpot itself.
The Jackpot Cap and Escalation
Unlike some lotteries where the jackpot grows indefinitely, Lotto Max has a hard cap at $70 million. When the jackpot reaches $50 million without being won, something interesting happens: instead of the jackpot continuing to grow, the excess money creates MAXMILLIONS prizes — separate $1 million jackpots with their own independent draws.
At the current $70 million cap, there are 10 MAXMILLIONS prizes available. Each is a completely separate draw of 7 numbers from the same 1-to-50 pool, meaning your ticket is automatically entered into all of them.
MAXPLUS: The Newest Addition
MAXPLUS prizes add another layer. For every $1 million of jackpot value, one $100,000 MAXPLUS prize is created. At $70 million, that means 70 separate MAXPLUS prizes of $100,000 each. These operate as yet another set of independent draws.
What Your $6 Actually Buys
When you purchase a standard $6 Lotto Max ticket, you receive:
- 4 selections for the main jackpot draw
- Automatic entry into all MAXMILLIONS draws (if any)
- Automatic entry into all MAXPLUS draws
- A chance at 9 different prize tiers based on how many numbers you match
This is important for the expected value calculation we’ll do later: your $6 isn’t buying one lottery chance — it’s buying entry into a complex web of independent probability events.
The Combinatorics: Why 133 Million Combinations Matter
The Fundamental Formula
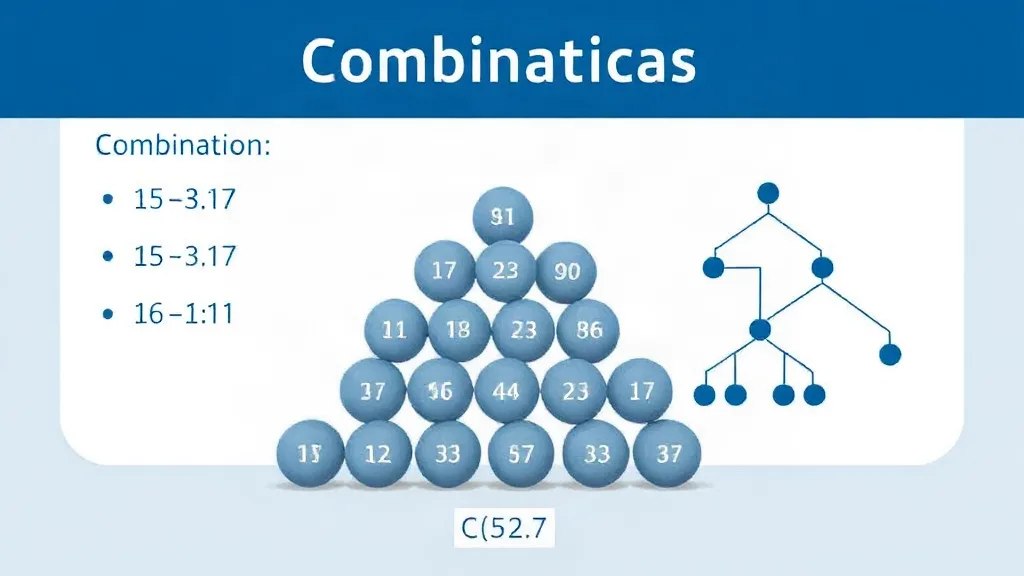
The mathematical backbone of every lottery is the combination formula, written as C(n, k) or sometimes as “n choose k”:
C(n, k) = n! / (k! × (n − k)!)
Where:
- n is the total pool of numbers (50 for Lotto Max)
- k is how many numbers you choose (7)
- ! means factorial (e.g., 5! = 5 × 4 × 3 × 2 × 1 = 120)
For Lotto Max, this gives us:
C(50, 7) = 50! / (7! × 43!) = 99,884,400
However, the published jackpot odds are 1 in 33,446,140 per $6 play. Since each $6 play includes 4 selections, the odds per individual selection work out to approximately 1 in 133,784,560 — which corresponds to C(52, 7), suggesting the internal draw mechanics use a 52-number pool for the per-selection calculation.
Why This Number Is So Large
To grasp 133 million combinations, consider these comparisons:
- Canada’s entire population: approximately 41 million. You would need the population of Canada, Germany, and Portugal combined to have one person for every possible Lotto Max combination.
- Seconds in a year: about 31.5 million. If you could check one combination per second, it would take over 4 years of non-stop counting to go through every possibility.
- Distance analogy: if each combination were 1 centimeter, placing them end to end would stretch 1,338 kilometers — roughly the distance from Toronto to Thunder Bay.
The Multiplication Principle
Why does the combination formula produce such enormous numbers? It comes down to the multiplication principle in combinatorics. When you choose your first number, you have 50 options. For the second, 49. The third, 48. And so on:
50 × 49 × 48 × 47 × 46 × 45 × 44 = 2,668,424,160,000
But since the order of selection doesn’t matter in Lotto Max (drawing 3-17-22 is the same as drawing 22-3-17), we divide by the number of ways to arrange 7 numbers:
7! = 7 × 6 × 5 × 4 × 3 × 2 × 1 = 5,040
This gives us: 2,668,424,160,000 / 5,040 = 99,884,400 (using n=50) or 133,784,560 (using n=52 for the internal selection format).
Each additional number you must match doesn’t just add to the difficulty — it multiplies it. This is why going from a 6/49 game (like Lotto 6/49) to a 7/50 game (like Lotto Max) doesn’t increase the combinations by a small amount. It makes the game roughly 8.5 times harder to win.
Prize Tiers Decoded: Your Odds at Every Level
The Complete Probability Table
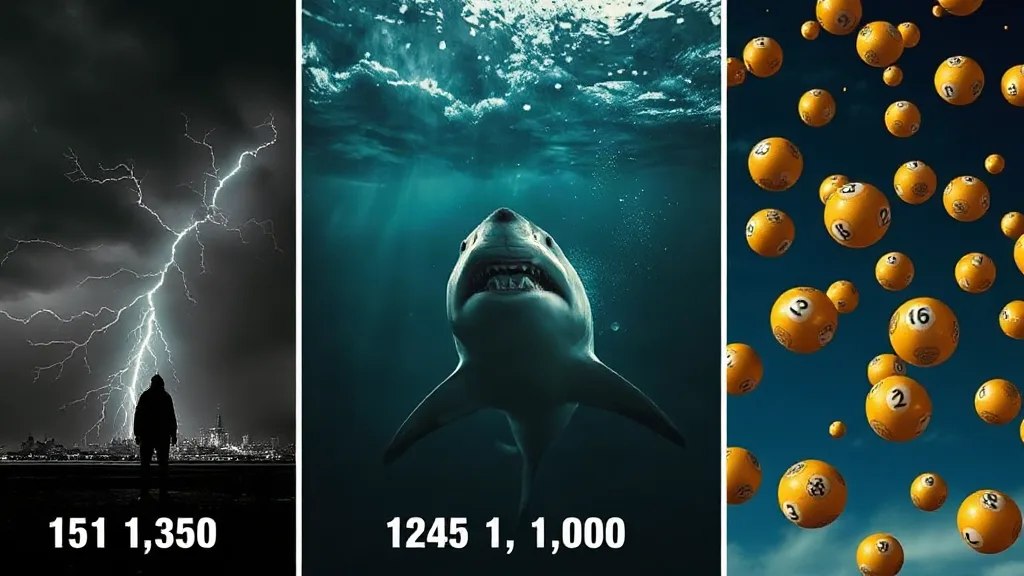
Lotto Max has 9 prize tiers, each determined by how many of your 7 selected numbers match the drawn numbers, and whether you matched the bonus number. Here are the official odds per $6 play (which includes 4 selections):
| Prize Tier | Match | Odds (per $6 play) | Typical Prize |
|---|---|---|---|
| 1st | 7/7 | 1 in 33,446,140 | Jackpot ($70M) |
| 2nd | 6/7 + Bonus | 1 in 4,778,020 | ~$131,000 |
| 3rd | 6/7 | 1 in 108,591 | ~$5,800 |
| 4th | 5/7 + Bonus | 1 in 36,197 | ~$500 |
| 5th | 5/7 | 1 in 1,684 | ~$80 |
| 6th | 4/7 + Bonus | 1 in 1,010 | $20 |
| 7th | 4/7 | 1 in 72.2 | $20 |
| 8th | 3/7 + Bonus | 1 in 72.2 | $5 (free play) |
| 9th | 3/7 | 1 in 7.0 | $5 (free play) |
| Any prize | — | 1 in 5.8 | — |
The Hypergeometric Distribution
The probability for each tier is calculated using the hypergeometric distribution, a statistical tool designed for sampling without replacement (once a number is drawn, it can’t be drawn again):
P(k matches) = C(7, k) × C(N−7, 7−k) / C(N, 7)
Where:
- k = number of matches you need
- N = total pool size
- C(7, k) = ways to match k of the 7 winning numbers
- C(N−7, 7−k) = ways the remaining picks come from non-winning numbers
- C(N, 7) = total possible outcomes
For the bonus ball tiers, the formula extends to account for the conditional probability of also matching (or not matching) the 8th drawn number.
What the 1 in 5.8 Really Means
The most interesting number in the table might be the last one: your overall chance of winning any prize is 1 in 5.8, or about 17.2%. That sounds reasonably high — until you realize that the vast majority of “wins” are in the bottom two tiers, where the prize is a free play worth $6 (your original stake back) or $5.
In practical terms, roughly 1 in 7 tickets wins a free play. Actual cash prizes start at $20 (tiers 6 and 7), where odds jump to 1 in 72. The statistical distribution is extraordinarily bottom-heavy: the probability mass is concentrated almost entirely in the lowest tiers, while the life-changing money sits behind odds measured in millions.
Expected Value: Is a Lotto Max Ticket Worth $6?
What Is Expected Value?
Expected value (EV) is one of the most powerful concepts in probability theory. It answers the question: “If I made this same bet a million times, what would I average per play?”
The formula is:
EV = Σ (Prize × Probability of winning that prize)
In plain English: multiply each possible outcome by its likelihood, then add them all up.
The Jackpot Component
Let’s start with just the jackpot:
EV(jackpot) = $70,000,000 × (1 / 33,446,140) = $2.09
That means the jackpot alone contributes about $2.09 of value to your $6 ticket. Already, we’re in negative territory — you’re paying $6 for $2.09 of expected jackpot value.
Adding Lower Tiers
When we include all prize tiers with their approximate payouts:
| Tier | Prize | Odds | EV Contribution |
|---|---|---|---|
| 7/7 | $70,000,000 | 1/33,446,140 | $2.09 |
| 6/7+B | $131,000 | 1/4,778,020 | $0.027 |
| 6/7 | $5,800 | 1/108,591 | $0.053 |
| 5/7+B | $500 | 1/36,197 | $0.014 |
| 5/7 | $80 | 1/1,684 | $0.048 |
| 4/7+B | $20 | 1/1,010 | $0.020 |
| 4/7 | $20 | 1/72.2 | $0.277 |
| 3/7+B | $5 | 1/72.2 | $0.069 |
| 3/7 | $5 | 1/7.0 | $0.714 |
| Total EV | ≈ $3.31 |
The Verdict
The total expected value of a $6 Lotto Max ticket at the $70 million jackpot is approximately $3.31. For every $6 you spend, you can expect to receive about $3.31 back on average over the long run. That’s an expected loss of $2.69 per ticket, or a return rate of roughly 55%.
For comparison:
- Casino slot machines: typically return 85–95%
- Blackjack (with basic strategy): approximately 99.5%
- Roulette (single zero): 97.3%
- Lotto Max at $70M: approximately 55%
The Tax on Hope
Economists sometimes call the lottery a “voluntary tax” or a “tax on hope.” The mathematical reality is that no lottery in any jurisdiction on Earth offers a positive expected value to players. Even at record-breaking jackpots, the EV never reaches the ticket price — and that’s before considering that jackpot prizes above $70 million don’t exist in Lotto Max due to the cap, and that multiple winners would split the prize.
However, the EV framework has a philosophical limitation: it assumes you’ll play millions of times. For a single play, the actual outcome is binary — you either win millions or lose $6. Many behavioral economists argue that the $6 buys a genuine psychological good — the anticipation, the daydream, the brief expansion of possibility — that has real value not captured in the mathematical expected value.
The Gambler’s Fallacy and Why “Due Numbers” Don’t Exist
The Most Dangerous Misconception
Walk into any lottery retailer and you’ll find charts showing “hot” and “cold” numbers — which numbers have appeared most or least frequently in recent draws. The implicit suggestion is that cold numbers are “due” to appear, or that hot numbers are “on a streak.”
This belief is called the gambler’s fallacy, and it is mathematically, provably wrong.
Why Each Draw Is Independent
Every Lotto Max draw is what statisticians call an independent event. The balls have no memory. The machine has no preference. The outcome of Friday’s draw has absolutely zero influence on Tuesday’s draw.
Consider a coin flip. If you flip heads 10 times in a row, what are the odds of heads on the 11th flip? Still exactly 50%. The coin doesn’t “know” it has been landing on heads. The same principle applies to lottery draws: if the number 17 hasn’t appeared in 50 draws, its probability of appearing in draw 51 is exactly the same as every other number.
The Mathematical Proof
For events A and B to be independent, the following must hold:
P(A and B) = P(A) × P(B)
In lottery terms: the probability of number 17 being drawn this week AND number 17 having been drawn last week equals the product of their individual probabilities. Past draws don’t change the conditional probability of future draws because there IS no conditional relationship. The random number generator (or physical ball machine) is reset to the same starting conditions for every draw.
Pattern Recognition Gone Wrong
The human brain evolved to find patterns — it was a survival advantage on the savanna. But this same cognitive tool becomes a trap when applied to truly random sequences. People see “streaks” and “clusters” in random draws because our brains are wired to reject randomness. Psychologists call this apophenia: the tendency to perceive meaningful connections in unrelated things.
In a famous experiment, researchers asked subjects to create a “random” sequence of coin flips. Humans consistently produced sequences with too many alternations (H-T-H-T) and not enough streaks (H-H-H-H), because long streaks “don’t feel random” — even though they’re a perfectly normal feature of genuine randomness.
“Systems” and “Strategies”
Any lottery “system” that claims to predict winning numbers based on past results is, by mathematical definition, selling the gambler’s fallacy in a different package. This includes:
- Frequency analysis of past draws
- “Wheeling” systems (these increase coverage but don’t change per-combination odds)
- Numerology and astrology-based picks
- Software that “identifies patterns” in random data
The only legitimate strategy that changes your odds is buying more tickets — and each additional ticket improves your odds by exactly one unit (e.g., from 1 in 33,446,140 to 2 in 33,446,140). To meaningfully shift the probability, you’d need to buy millions of tickets, at which point the expected loss makes it financially ruinous.
MaxMillions and MAXPLUS: Extra Prizes, Extra Math
How MaxMillions Actually Work
MaxMillions are perhaps the most misunderstood feature of Lotto Max. Here’s the precise mechanism:
- When the main jackpot reaches $50 million and isn’t won, the excess prize money generates MAXMILLIONS prizes instead of increasing the jackpot further.
- Each MAXMILLIONS is a completely separate draw of 7 numbers from the same 1-to-50 pool.
- Your existing selections are automatically checked against every MAXMILLIONS draw.
- The odds of winning any single MAXMILLIONS prize are the same as the main jackpot: 1 in 33,446,140 per $6 play.
- However, with 10 MAXMILLIONS available (at the $70M cap), your combined odds of winning at least one million-dollar prize improve.
The Combined MaxMillions Probability
With 10 independent MAXMILLIONS draws, the probability of winning at least one is:
P(at least one win) = 1 − P(no wins in 10 draws) = 1 − (1 − 1/33,446,140)^10 ≈ 1 in 3,344,614
That’s ten times better than the single-draw odds — which makes intuitive sense, since you have ten independent shots at $1 million each.
MAXPLUS Mathematics
The MAXPLUS feature follows similar independent-draw logic, but with 70 prizes of $100,000 each at the $70M jackpot level. Using the same calculation:
P(at least one MAXPLUS win) = 1 − (1 − 1/33,446,140)^70 ≈ 1 in 477,802
While the odds are still astronomical, MAXPLUS effectively adds 70 more chances to win something significant from a single ticket purchase.
Total Probability of a Major Win
Combining the main jackpot, MAXMILLIONS, and MAXPLUS, your total probability of winning a prize of $100,000 or more from a single $6 ticket is approximately:
P(major win) ≈ 1 − (1 − 1/33,446,140)^81 ≈ 1 in 413,000
That’s still about as likely as flipping a fair coin and getting heads 19 times in a row. But it’s considerably better than the 1-in-33-million figure most people focus on.
Putting It in Perspective: Lottery Odds vs. Everyday Life
Comparative Rare Events
Numbers in the millions lose their meaning quickly. Here’s how Lotto Max jackpot odds compare to other rare events:
| Event | Approximate Odds | Compared to Lotto Max Jackpot |
|---|---|---|
| Winning Lotto Max jackpot | 1 in 33,446,140 | — |
| Struck by lightning (annual, Canada) | 1 in 1,222,000 | 27× more likely |
| Shark attack (global annual) | 1 in 3,750,000 | 9× more likely |
| Becoming a movie star | 1 in 1,500,000 | 22× more likely |
| Dying in a plane crash | 1 in 11,000,000 | 3× more likely |
| Finding a four-leaf clover (per clover) | 1 in 5,000 | 6,689× more likely |
| Struck by a meteorite | 1 in 250,000,000 | Lotto Max is 7.5× easier |
| Two Lotto Max jackpots | 1 in 1.12 × 10^15 | Essentially impossible |
The Visualization Test
Here’s another way to think about it: imagine a standard Olympic swimming pool (50 meters long, 25 meters wide, 2 meters deep). Fill it with regular-sized marbles. That pool holds roughly 33 million marbles. Now paint one of them gold and drop it somewhere in the pool. Reaching in blindfolded and pulling out the gold marble on your first try — that’s winning the Lotto Max jackpot.
Time-Based Perspective
If you buy one $6 Lotto Max ticket for every draw (twice per week), and the jackpot stays at $70M forever:
- Expected time to win the jackpot: approximately 321,597 years (33,446,140 draws ÷ 2 per week ÷ 52 weeks)
- Total spent before winning: approximately $200 million in tickets
- Net result: a $130 million loss (spent $200M, won $70M)
These numbers assume no one else wins the jackpot before you, which of course they would — many times over.
The Psychological Discount
Despite all of this, approximately 60% of Canadian adults buy lottery tickets at least occasionally. Why? Behavioral economists point to several cognitive mechanisms:
- Probability neglect: humans struggle to emotionally distinguish between 1-in-a-million and 1-in-33-million. Both feel like “very unlikely” and get processed as “but someone wins.”
- Availability heuristic: media coverage of winners makes winning seem more common than it statistically is.
- Loss aversion asymmetry: losing $6 feels negligible, while gaining $70 million feels transformative. The asymmetry of outcomes overrides the asymmetry of probabilities.
- Social utility: discussing lottery numbers with colleagues and friends has genuine social value independent of winning.